Bringing Firebase Crashlytics into Android Studio

Android Studio Electric Eel, v2022.1.1 brings with it a lot of cool new features amongst which is The new App Quality Insights tool window.
App Quality Insights tool window allows you to view your app’s crashes in Android Studio itself, without having to open Firebase Crashlytics in a browser to view your crashes and their stats.
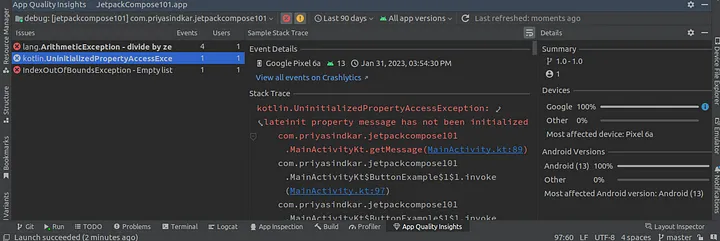
Summary of features available with the App Quality Insights
- View crash stack traces with logcat-like links to jump to the line of code causing a crash
- View the number of users affected by each crash event
- View various stats about each crash like no of devices affected, android versions affected, most affected device, etc.
- Filter results based on date range, app version, severity of a crash
- Direct link to open Firebase Crashlytics in browser to view more details
- Crash indications in the gutter beside the line of code where crashes have occurred
Steps to integrate Firebase Crashlytics in Android Studio
Step 1. Connect your Android app with Firebase
This is the most basic step one follows to connect an Android app with Firebase. If you are a regular Android and Firebase developer, you already are well aware of this step. If so, skip to Step 3.
To integrate Firebase Crashlytics in your app you first need to connect your app with Firebase on the Firebase Console. Briefly, the steps to do so are as follows: Go to Firebase Console -> Create a new Project -> Connect Firebase with your Android app within the new project -> Add the google-services.json file to the Android app’s root folder.
Step 2. Add Crashlytics dependencies to your project
Again, a very common step to add the Crashlytics SDK to your Android app project.
Add the following dependencies to your project-level build.gradle file-
Add the following to your app-level build.gradle file-
Step 3. Log in with your Firebase account in Android Studio
For projects already integrated with Crashlytics and login already done in Android Studio, opening the App Quality Insights tool window will start showing the crash analytics immediately.
To access the crash logs, we need to log in with that email ID which has access to the Firebase console for the said app.
To login,
Click on the “Get started with Firebase” link shown in the yet-to-be-integrated App Quality Insights tool window (View->Tool Windows-> App Quality Insights).

Or,
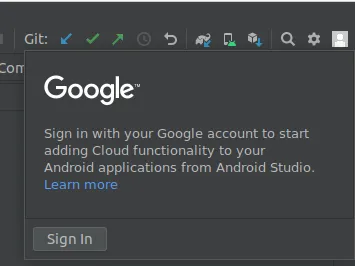
Click on the profile image on the top-right corner of Android Studio. There, you can add your account and get started.
Avoiding the PERMISSION_DENIED error
If like me, you too work on your office and personal projects from the same Android Studio, you may come across this error while switching between 2 projects-
PERMISSION_DENIED: The caller does not have permission
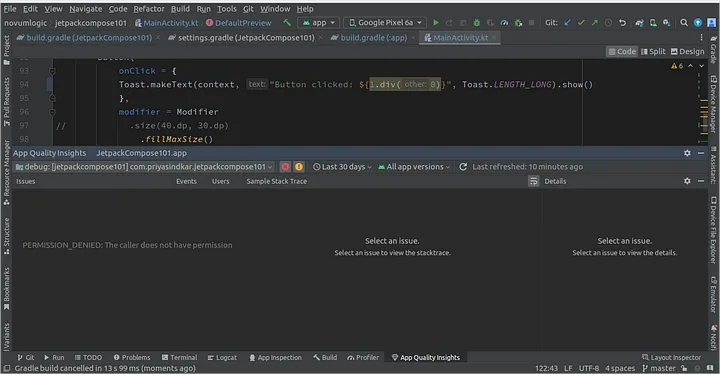
And if you too, like me are somehow too tired while trying out this tool window, you might not get to the simple solution to this error quickly.
So here is the solution to the above error which I got to after wasting two precious hours wondering what could have gone wrong and re-checking all dependencies and Gradle version multiple times-
Click on the profile image on the top-right corner of Android Studio and select the account with access to this Firebase project!
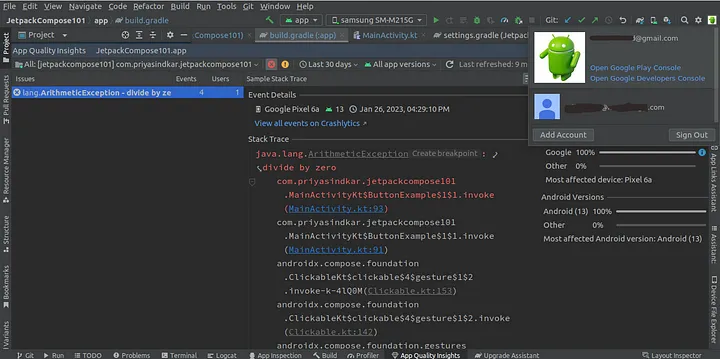
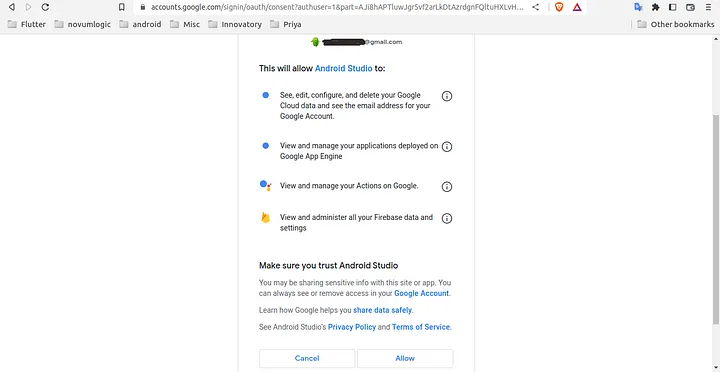
While logging, you will be asked to allow Android Studio to access some data. We must click on Allow to integrate our App Quality Insight window.
Step 4. Start getting the most out of the tool!
After completing the above step, go to Android Studio and you will now be able to access your crash logs in the App Insights window.
The App Quality Insights tool Window
Most of the features from the tool can be found very well-versed in this official blog post by Android Developers.
Exploring a little further, here are some other features that this tool has to provide-
- Refresh- Use the refresh button to quickly refresh the crash logs. (This refresh is faster than when we refresh Crashlytics in the browser)
2. Once a crash is closed from the Firebase console, the gutter indications and the crash logs are wiped out. To see that particular crash log again in the app insights window, we need to reopen the bug from the console.
3. Arrange issue list panel columns as per convenience. For example- We may want to prioritise all the events based on no of times that issue is faced or number of users affected by the event and might not want to look at the actual crash.
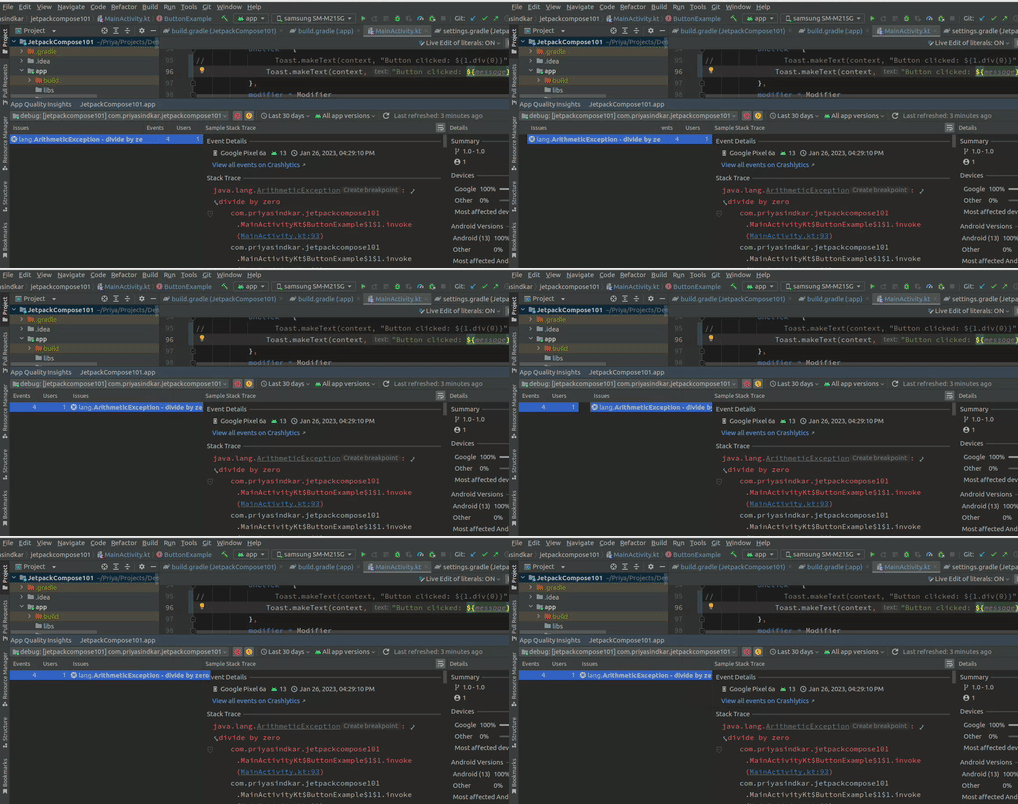
4. Direct link to open Crashlytics in the browser for detailed analysis, when we need to dig deep into the crash and view other data like region, user engagement, user activity, etc.

5. Create a Java Exception breakpoint from the stack trace
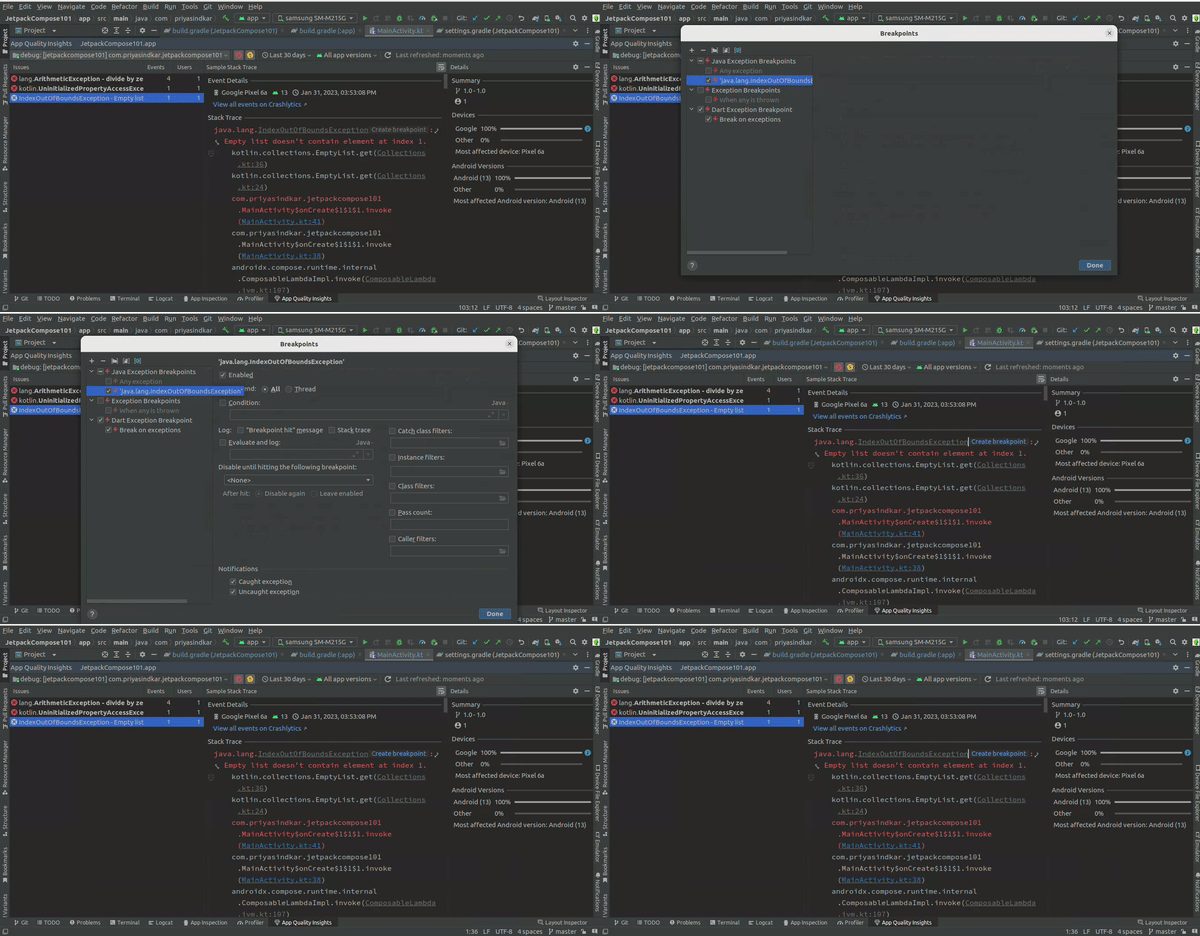
This feature is super helpful when you may not be able to reproduce this crash and would like to put a breakpoint for this exception to get more clarity on the bug.
Conclusion
Having the App Quality Insight tool window inside our app helped us to quickly work on the crashes, new and old. We are already using the tool to address all crashes and taking one step towards making a crash-free application. Analysing the app crashes has also become a speedy process for us which reduces considerable time that was earlier lost in switching between Android Studio and the browser. Refresh time in Android Studio is also less comparatively as only limited, required information is shown in Studio.


